O-rings are the first option product design engineers consider when sealing because of their simplicity, versatility, robustness, ease of use and cost. Although the O-rings are unquestionably the best seal for various installations, among cross-section, compression percentage and material, designers also should check O-ring compression force when designing with O-rings.
Contents covered in this article
Advertisement
Advertisement
What is an O-ring?
An O-ring is a doughnut-shaped, closed circle made of elastomeric rubber. The purpose of the O-ring seal is to prevent unwanted leakage or loss of gas or fluid. Industrial outdoor equipment such as IoT gateways, Thermal cameras, radio transmitters, consumer products such as garden lights, GPS trackers, and household cameras use sealing to avoid water ingress.
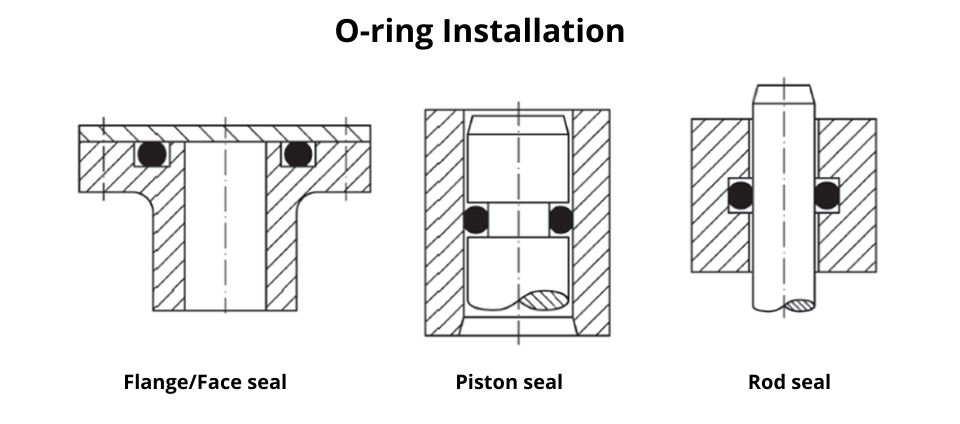
Product designs could have O-rings installed in three ways; each type has its considerations, as shown below.
What is the O-ring compression force?
The force necessary to compress an O-ring to maintain an acceptable sealing line of contact is called the O-ring compression force. It is critical in some applications, mainly when the available compression load is limited in face-type seals. Such as lids or plates clamped down using self-tapping screws or metal inserts on plastics.
Compression force factors
The force required to compress an o-ring seal depends primarily on the following factors.
- O-ring shore hardness
- Cross section
- Compression percentage
O-ring shore hardness
The hardness of elastomeric material is one of the most important factors to consider, typically measured and denoted by Shore A durometer. The image below shows other shore grades and represents how hardness varies.
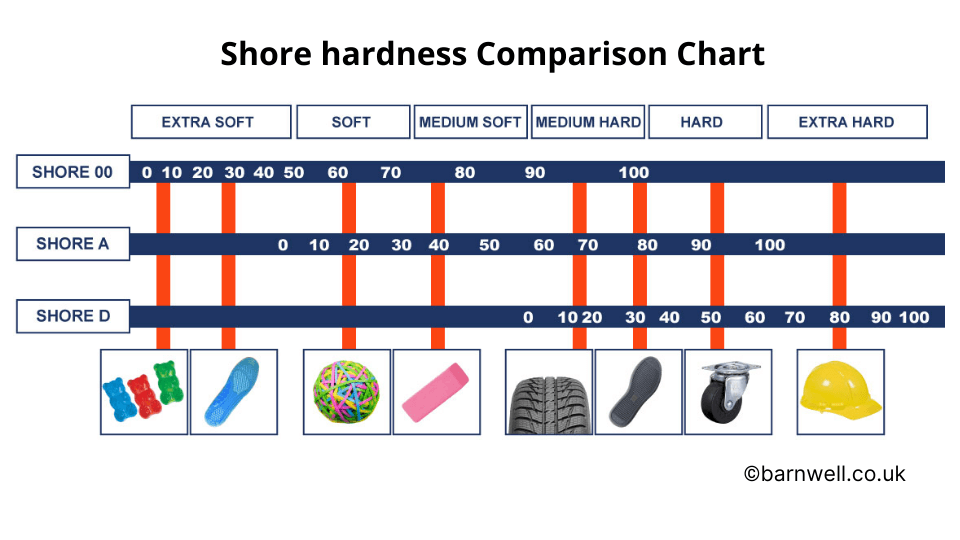
In terms of o-ring hardness, softer O-ings can flow and squeeze into microfine grooves and imperfections of parts like glands, bore and sealing flanges and increase the sealing ability. Conversely, harder material resists extrusion, preventing o-rings from squeezing out of gaps such as the gap between the piston and bore.
For most common applications, o-rings having a shore A durometer hardness between 70 and 80 are a good choice.
Cross sections
The o-ring cross-section is the diameter of the round cross-section of the o-ring cord, as shown below. AS568 and ISO 3601 sizes are the most common o-ring standards, and its economy good to choose from one of these standards as these are widely available. The sizes are sorted into five groups of differing cross-sectional thicknesses.
| Imperial (inch) AS568 | Metric (mm) ISO 3601 |
| 0.04 | 1.02 |
| 0.05 | 1.27 |
| 0.06 | 1.52 |
| 0.07 | 1.78 |
| 0.103 | 2.62 |
| 0.139 | 3.53 |
| 0.21 | 5.33 |
| 0.275 | 6.99 |
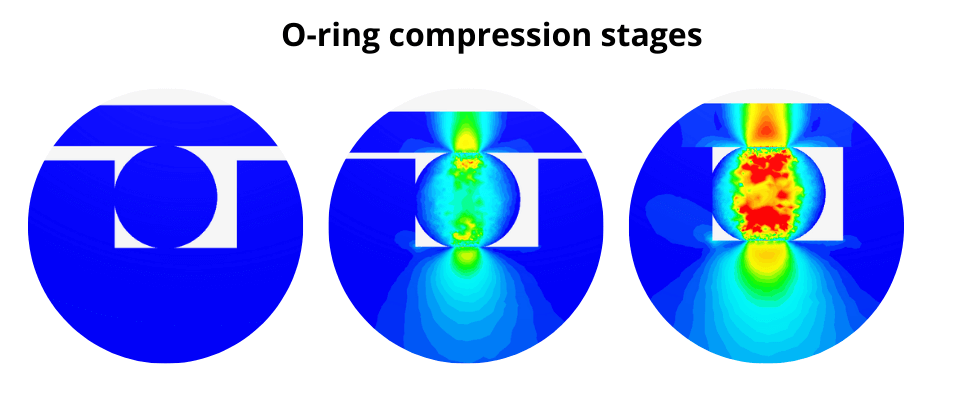
Compression squeeze percentage
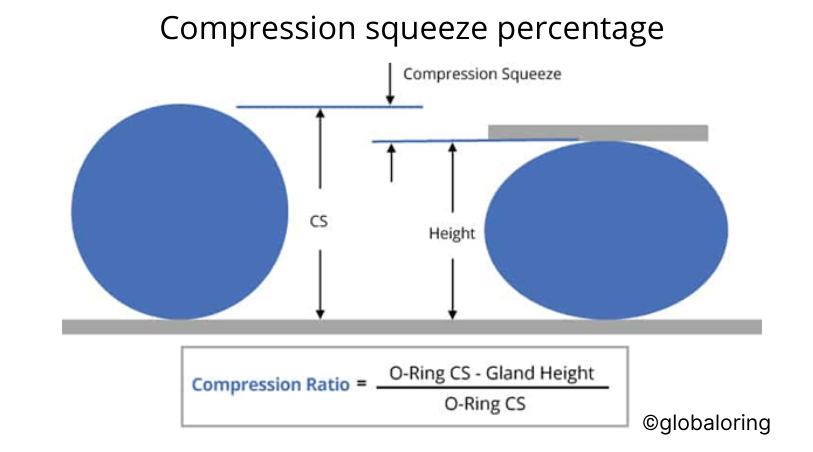
Compression squeeze is the ratio between the deformed o-ring height and the original cross-section, expressed as a percentage. Define the compression percentage for your design. Generally, compression varies per the sealing method and can be listed below.
- Face seal – 20 – 30%
- Static Male/Female – 18 – 25%
- Reciprocating – 10 – 20%
- Rotary – 0 – 10%
O-ring sealing ability is proportional to the force applied against the mating parts; the tighter the seal, the greater the squeeze. However, this does not always imply that designers should always specify the most squeeze. When selecting a compression squeeze percentage, consider the following factors.
- Seal tightness
- Mating part stress induced by the compression force
- Friction and wear ( this is only applicable for dynamic o-ring applications) – Surface finish of the groove surface
- O-ring damage
- Compression set
How do you calculate the compression force of an O-ring?
Gather O-ring Information – Design
Gather the following O-ring specification from the supplier or manufacturer’s datasheet. If you are using one of the standard o-rings, this information is widely available from many suppliers.
- O-ring cross section diameter – mm or inch
- O-ring internal and outer diameter – mm or inch
- Shore hardness A Durometer
- Calculate or measure O-ring cord length – mm or inch
Compression percentage
Define the compression percentage for your design. Generally, compression varies per sealing method and depends on the specific design.
- Face seal – 20-30%
- Static Male/Female – 18-25%
- Reciprocating – 10-20%
- Rotary – 0-10%
Compression force data
Using the o-ring cross section, compression percentage and Shore hardness of the o-ring, find the compression force range from the compression force logarithmic plot. ( See plots in the section below)
The Y-axis is grouped into compression percentages, and the X-axis is the compression force per inch of the o-ring cord.
Since the compression force vs cross section graphs are only available for O-ring sizes between 0.07″ and 0.275″, for other cross sections, the force can be interpolated or extrapolated. For example, the table shows the calculated force for 0.04″ o-ring CS from 0.07 and 0.103.
| Cross-section (inch) | Force for 20% (lbs) | |
| Fmax_0.070 | 0.07 | 10.00 |
| Fmax_0.103 | 0.103 | 11.60 |
| Fmax_0.04 | 0.04 | 8.55 |
Total Force
Since the reading is a range for reasons we discussed earlier, the designer has to decide what value to consider for the calculation, minimum, maximum or average. Selection is purely down to the risk factor the design can cope with before failure. For example, the plastic threads are very fragile and, most of the time, the weakest part of the design. Hence I would always take the maximum value at the start to see whether we could cope with the design changes stemming from the value of our design.
Force calculation
- Maximum total force = o-ring cord length x maximum compression force
- Minimum total force = o-ring cord length x minimum compression force
- Average total force = o-ring cord length x average compression force
O-Ring Compression Force vs O-ring sizes
Due to the nature of o-ring compression, even if all the above factors remain the same, compressive force will vary due to material, cross-section tolerance, and seal orientation, such as face and axial. Hence the force is generally given as a range, as shown in the graphs below.
Unfortunately, these data are from O-ring manufacturer’s tests and are only available for five cross sections.
Please note that although the temperature softens the o-ring material, the compression force decreases very little and can be disregarded.
Compression force for 0.070” CS O-rings
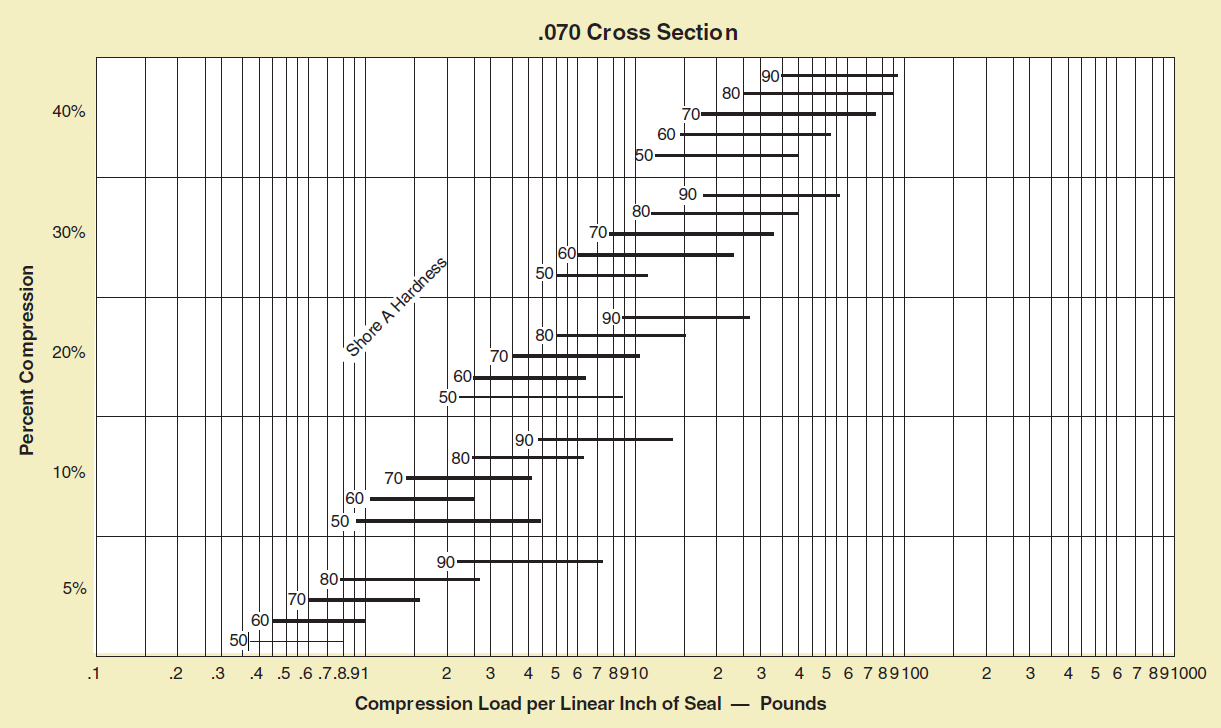
- Y-axis – O-ring compression squeeze percentage (%)
- X-Axis – Force required per inch of o-ring in pounds(lb)
Compression force for 0.103” CS O-rings
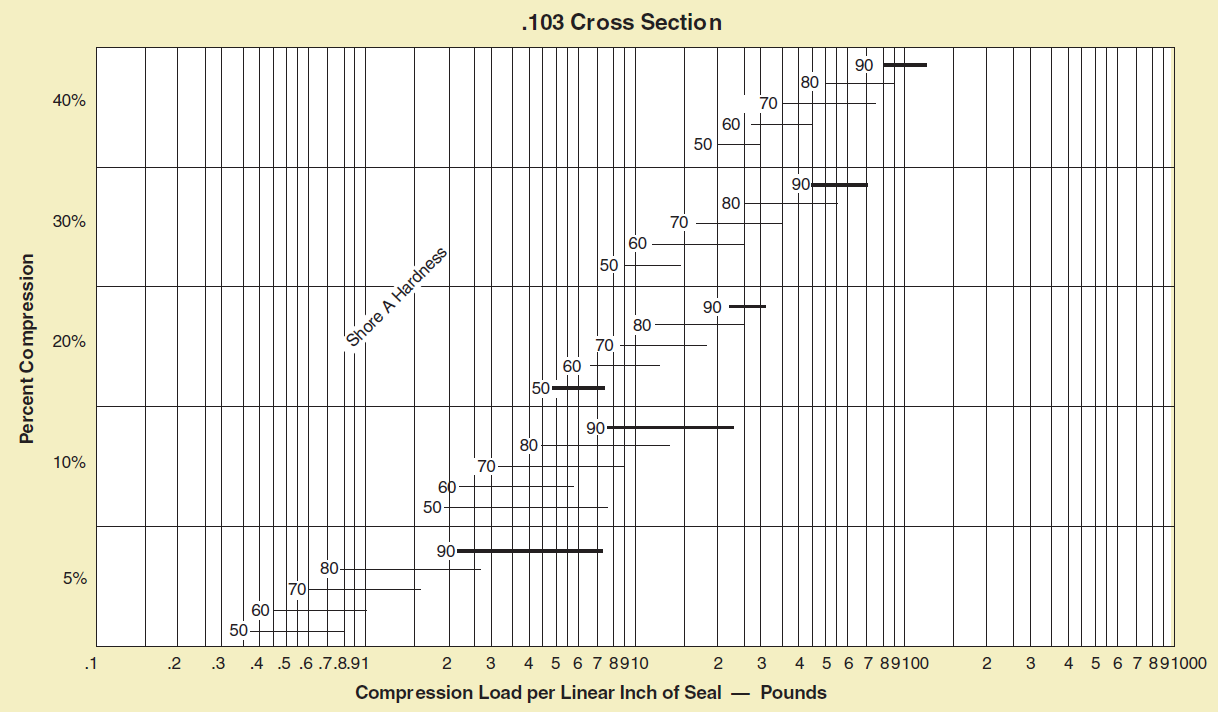
- Y-axis – O-ring compression squeeze percentage (%)
- X-Axis – Force required per inch of o-ring in pounds(lb)
Compression force for 0.139” CS O-rings
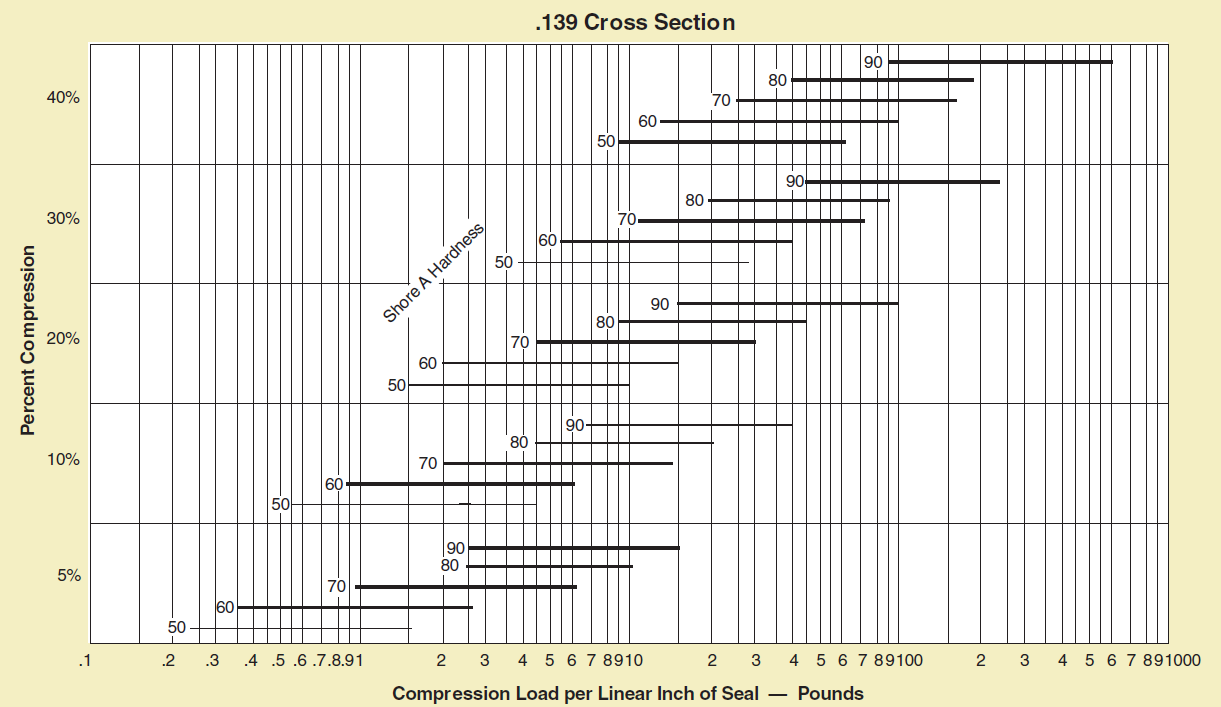
- Y-axis – O-ring compression squeeze percentage (%)
- X-Axis – Force required per inch of o-ring in pounds(lb)
Compression force for 0.210” CS O-rings
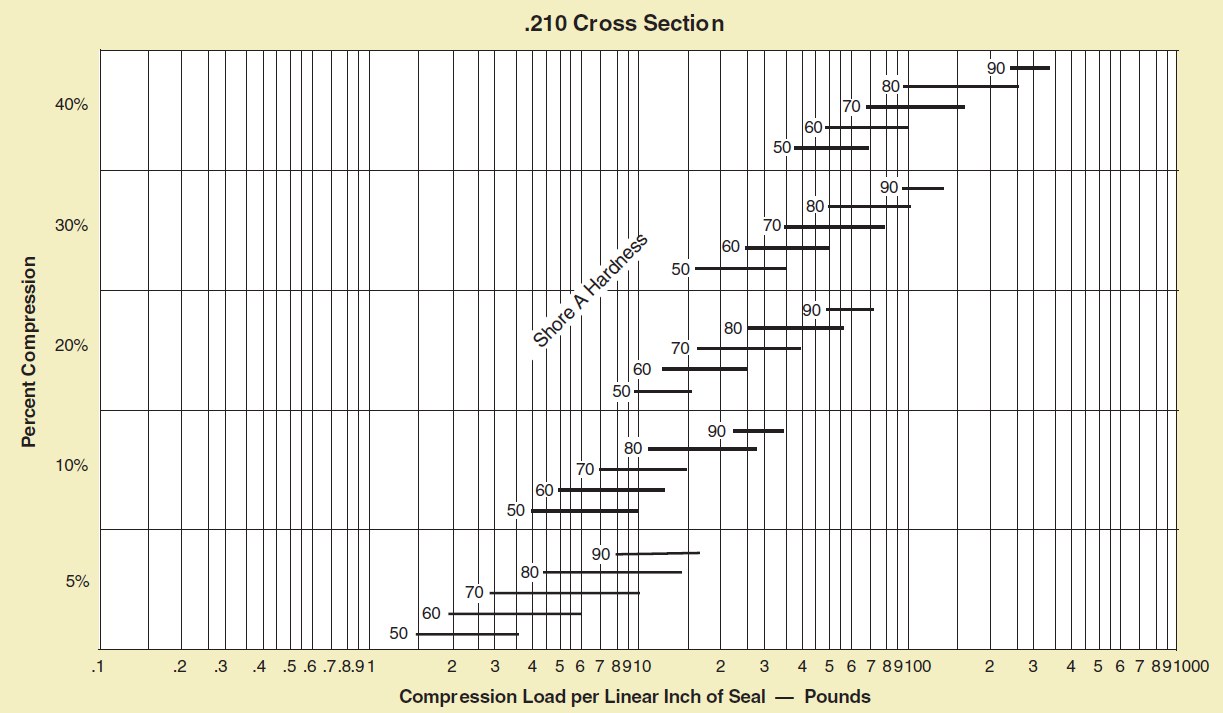
- Y-axis – O-ring compression squeeze percentage (%)
- X-Axis – Force required per inch of o-ring in pounds(lb)
Compression force for 0.275” CS O-rings
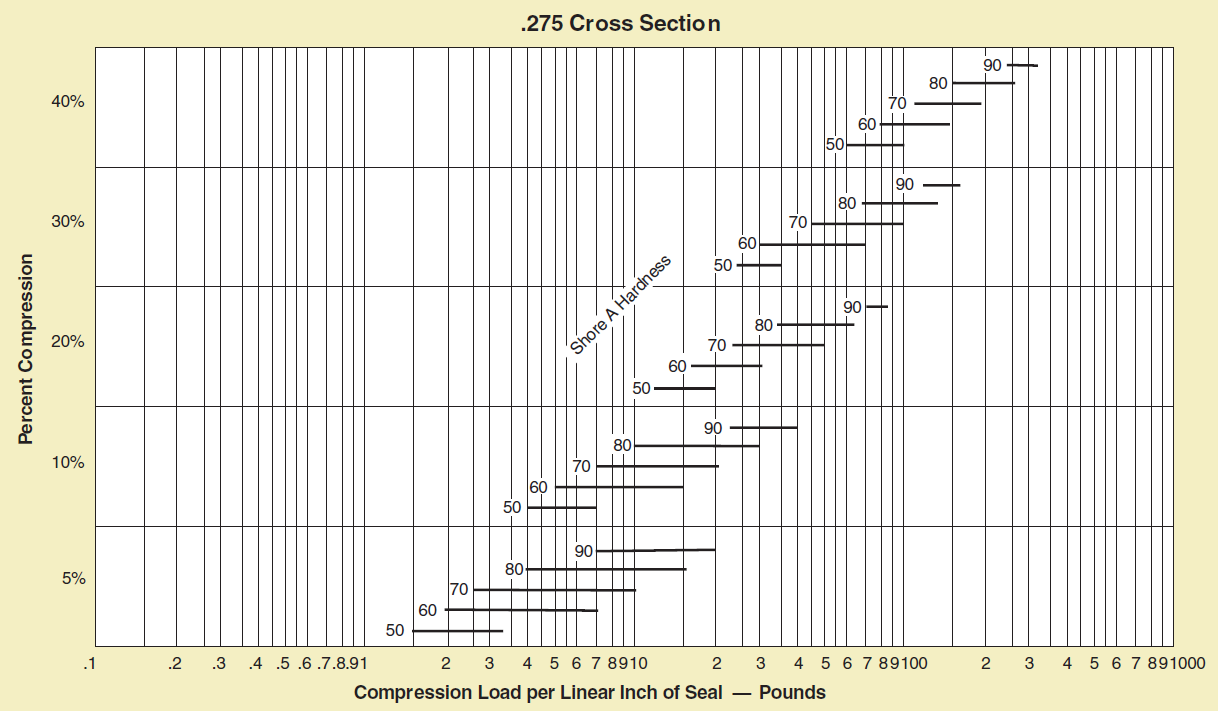
- Y-axis – O-ring compression squeeze percentage (%)
- X-Axis – Force required per inch of o-ring in pounds(lb)